
You are all already familiar with the Team Tracking Dashboard, which provides an overview of a team’s work.
There are now two additional tracking tools in LabNbook:
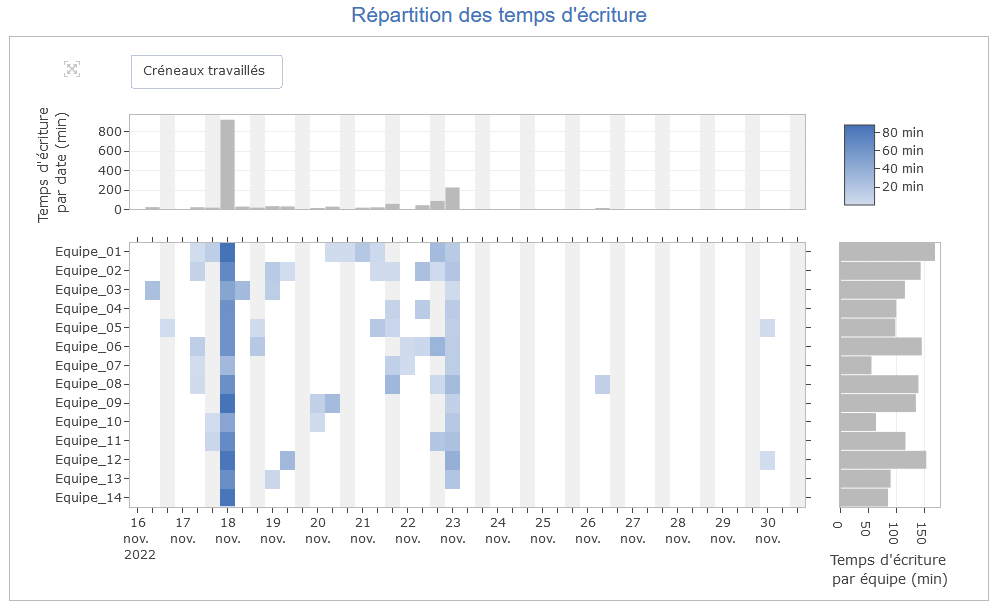
- The first one allows you to know the work dynamics of a class and it takes the form of a “heatmap” based on the writing time of the teams. To access this map, go to the “Reports” tab, choose a class and a mission. Underneath the list of your students’ reports is a map that looks like this:
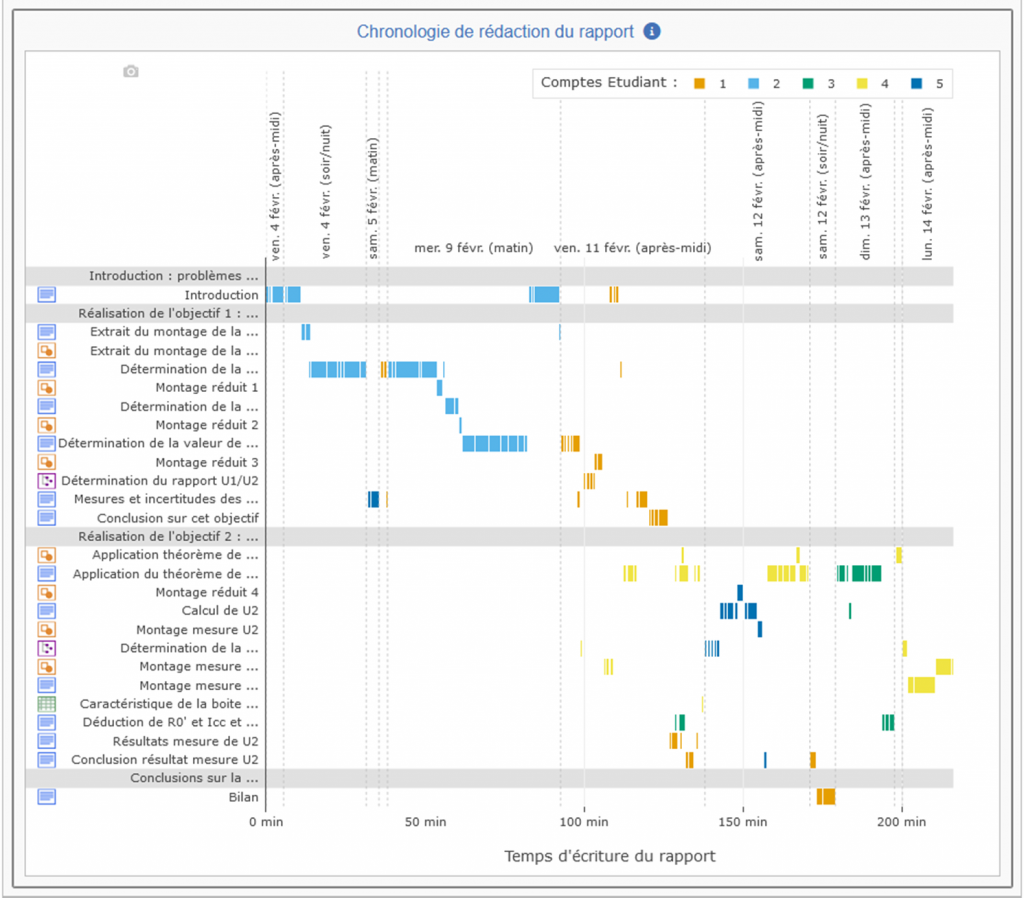
- The second tool details the chronology of a report writing and illustrates the temporal sequence of student interventions on each labdoc. It can help you analyze the collaborative strategies used to co-write the report. To access this map, go to the “Reports” tab, choose a team and click on “Display the writing chronology”. An example is shown below and you can also view a short demo video.
Of course, both of these tools are student support tools, not assessment tools: several students can work with the same account, they can copy and paste large amounts of text in seemingly no time, etc. Thus, we have not included students’ names in these tracking tables.
Your comments will be much appreciated!